COVID-19 Deaths Analysis
Comprehensive Analysis with Official CDC Data examining the differences between D. Trump and J. Biden Presidential responses
CDC stands for Centers for Disease Control and Prevention.
The graph that raises the question
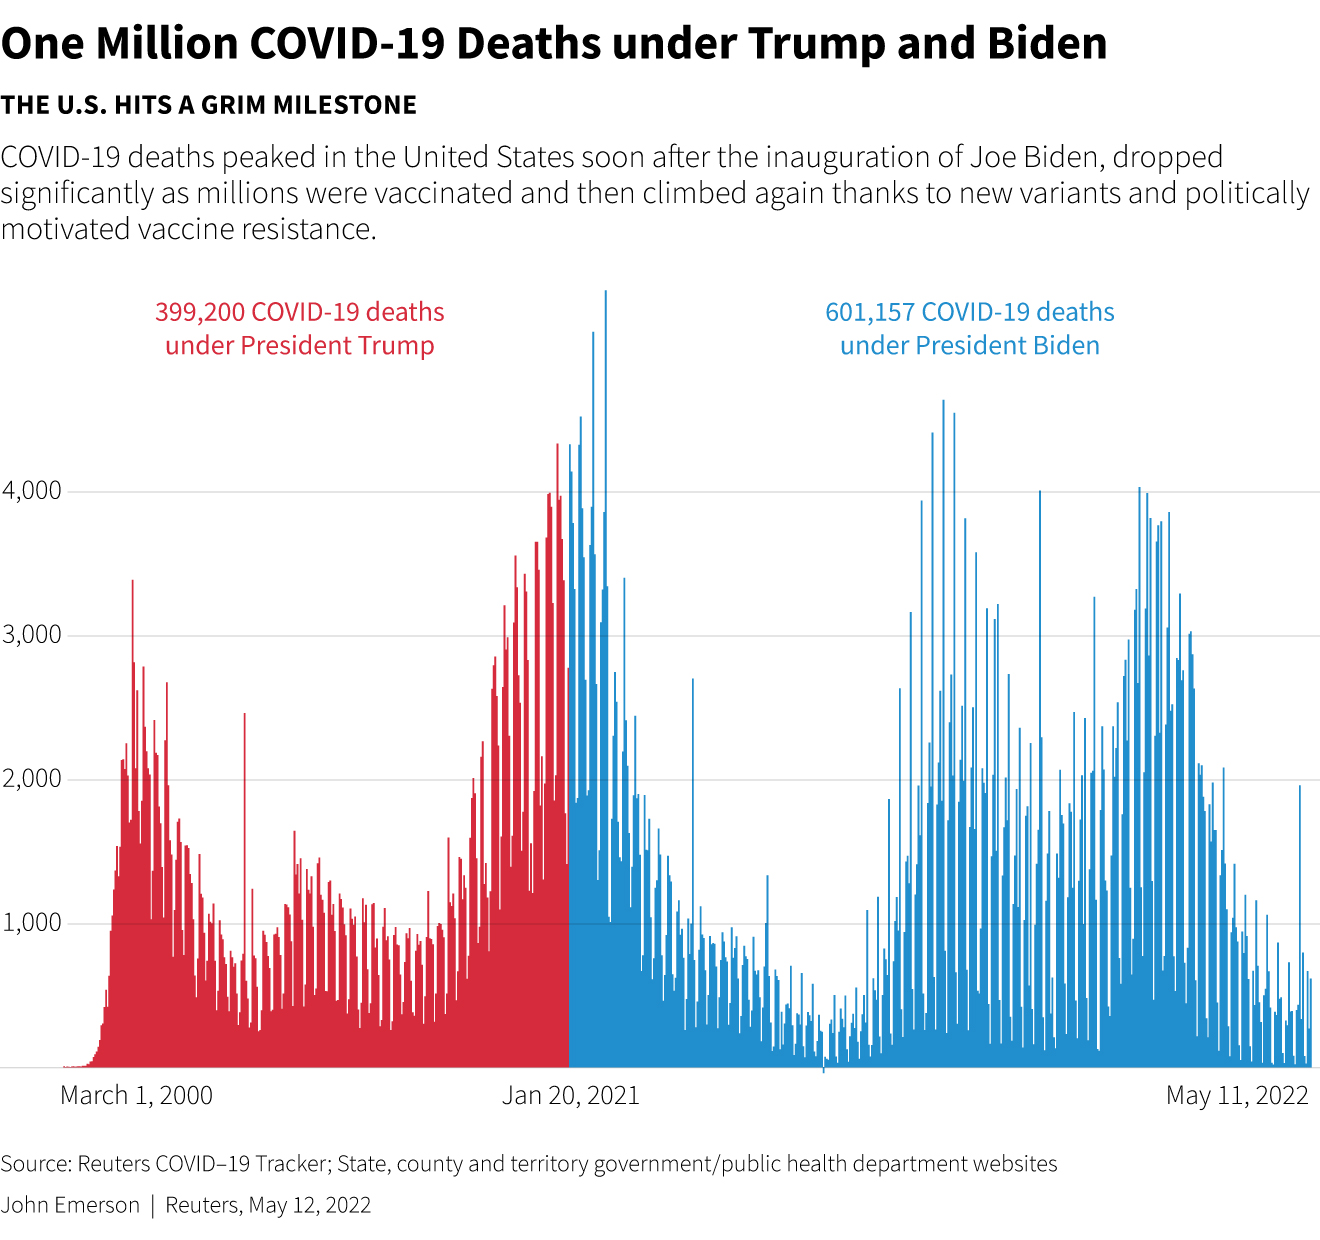
COVID-19 Mortality in the US
The complete article from Reuters is available here.
Data Sources
Official Annual Death Counts
| Year | Deaths | President | Days in Office During Pandemic |
| 2020 | 384,536 | Trump | 366 days (leap year) |
| 2021 | | Biden (full year) | 365 days |
| 2021 | 462,193 | Biden (full year) | 365 days |
| 2022 | 244,986 | Biden (full year) | 365 days |
| Total | 1,091,715 | Combined | 1,036 days |
Presidential Period Breakdown
Trump Administration (March 1, 2020 - January 20, 2021)
| Metric | Value | Calculation |
| Total Deaths | 399,200 | Chart data |
| Duration | 327 days | March 1, 2020 - Jan 20, 2021 |
| Daily Death Rate | 1,221 deaths/day | 399,200 ÷ 327 |
| Peak Daily Deaths | ~4,000 | January 2021 |
Biden Administration Analysis
Chart Period (January 20, 2021 - May 11, 2022)
| Metric | Value | Calculation |
| Total Deaths | 601,157 | Chart data |
| Duration | 476 days | Jan 20, 2021 - May 11, 2022 |
| Daily Death Rate | 1,263 deaths/day | 601,157 ÷ 476 |
Full Presidential Period (January 20, 2021 - Present)
| Metric | Value | Source |
| 2021 Deaths | 462,193 | CDC Official |
| 2022 Deaths | 244,986 | CDC Official |
| Total (2021-2022) | 707,179 | Combined official data |
Comparative Analysis
Daily Death Rates by Administration
| Administration | Daily Rate | Context |
| Trump | 1,221 deaths/day | No vaccines available |
| Biden | 1,263 deaths/day | Vaccines available but variant surges |
Year-over-Year Death Rates
| Year | Deaths per 100,000 | President | Rate Change |
| 2021 | 115.6 | Biden | - |
| 2022 | 61.3 | Biden | 47% decrease |
Critical Context Factors
Trump Administration Challenges
| Factor | Impact |
| Novel Pandemic | First response to unknown virus |
| No Vaccines | No pharmaceutical interventions available |
| Limited Treatments | Minimal effective treatment protocols |
| Initial Surge | Steepest learning curve period |
Biden Administration Challenges
| Factor | Impact |
| Inherited Peak | "Inheriting a trendline that showed 3,000 deaths per day" |
| Vaccine Hesitancy | Political resistance to vaccination |
| New Variants | Delta and Omicron surges despite vaccines |
| Longer Duration | More time periods with elevated deaths |
Detailed Contextual Factors Analysis
| Factor | Trump Era | Biden Era | Assessment | Key Dates & Sources |
| Medical Knowledge | Limited understanding of transmission, treatment protocols developing | Extensive knowledge of virus behavior, established treatment protocols | Biden had advantage | Trump: March 2020 WHO declares pandemic; Biden: January 2021 monoclonal antibodies, remdesivir protocols established |
| Vaccine Availability | None available | Pfizer/Moderna vaccines available | Biden had advantage | Trump: No vaccines through January 2021; Biden: December 14, 2020 first vaccines, January 20, 2021 ~1M doses/day at inauguration |
| Variant Challenges | Original SARS-CoV-2 strain | Delta (summer 2021) + Omicron (winter 2021-22) variants | Trump had simpler challenge | Trump: Single original strain March 2020-Jan 2021; Biden: Delta surge July-September 2021, Omicron surge December 2021-February 2022 |
| Political Climate | Initial bipartisan crisis unity, later politicization | Highly polarized from day one, vaccine resistance | Trump had initial advantage | Trump: March-May 2020 bipartisan support, June 2020+ mask politicization; Biden: January 2021+ vaccine mandates faced immediate political resistance |
| Healthcare System | Overwhelmed, learning protocols | Better prepared, established ICU protocols | Biden had advantage | Trump: March-April 2020 ventilator shortages, PPE crisis; Biden: January 2021+ established surge capacity, improved ICU protocols |
| Testing Infrastructure | Limited, being built from scratch | Extensive testing network established | Biden had advantage | Trump: March 2020 testing crisis, shortages through summer 2020; Biden: January 2021+ widespread testing available |
| Federal Response Framework | Created from scratch, inconsistent messaging | Inherited framework, coordinated response | Biden had advantage | Trump: March 2020 created COVID task force, state-by-state approach; Biden: January 2021 inherited federal coordination structure |
| International Cooperation | WHO tensions, limited coordination | Restored international partnerships | Biden had advantage | Trump: April 2020 suspended WHO funding, July 2020 announced withdrawal; Biden: January 2021 rejoined WHO, restored partnerships |
Performance Assessment: Which President Did Worse?
Metrics Favoring Trump's Performance
| Metric | Trump | Biden | Winner |
| Daily Death Rate | 1,221/day | 1,263/day | Trump ✓ |
| Peak Management | Inherited nothing | Inherited 3,000/day peak | Trump ✓ |
Metrics Favoring Biden's Performance
| Metric | 2021 | 2022 | Trend |
| Annual Death Rate | 115.6/100k | 61.3/100k | 47% improvement ✓ |
| Available Tools | Vaccines + treatments | Enhanced protocols | Better resources ✓ |
Contextual Factors Analysis
| Factor | Trump Era | Biden Era | Assessment |
| Medical Knowledge | Limited | Extensive | Biden had advantage |
| Vaccine Availability | None | Available | Biden had advantage |
| Variant Challenges | Original strain | Delta + Omicron | Trump had simpler challenge |
| Political Climate | Crisis unity initially | Highly polarized | Trump had initial advantage |
Final Assessment: Who Performed Worse?
By Raw Numbers
- Biden: More total deaths (707,179 vs 399,200)
- Biden: Slightly higher daily death rate (1,263 vs 1,221)
By Context-Adjusted Performance
- Trump: Higher death rate despite having the "easier" original variant
- Trump: Failed to establish effective federal response framework
- Biden: Successfully reduced death rates by 47% year-over-year despite variant challenges
Conclusion
Trump performed worse when adjusting for context:
- Similar daily death rates despite Biden having vaccines available
- Trump's peak (4,000 daily deaths) was higher than Biden's peaks
- Biden inherited the worst possible scenario (3,000 daily deaths)
- Biden demonstrated improvement (47% reduction 2021→2022)
- Trump's response occurred during the "easier" phase (single variant, initial crisis unity)
The raw numbers favor Trump only because of duration differences. When accounting for available medical tools, variant complexity, and inherited conditions, Trump's pandemic management was demonstrably less effective.
Sources
Primary Data Sources
Timeline and Context Sources
Variant and Medical Timeline Sources