Fragment Types Documentation
This document demonstrates different fragment types (f_type) available in the PCA MathsPM system, with a focus on visual content handling.
Table of Contents
I. Image Fragments (image_)
Image fragments are created when markdown images are parsed. They support various formats including PNG, JPG, GIF, and WebP.
A. Basic Image Example
Standard image usage with relative path:
This creates an image_ fragment with:
- f_type: "image_"
- data.src: "files/covid19-states-analysis.png"
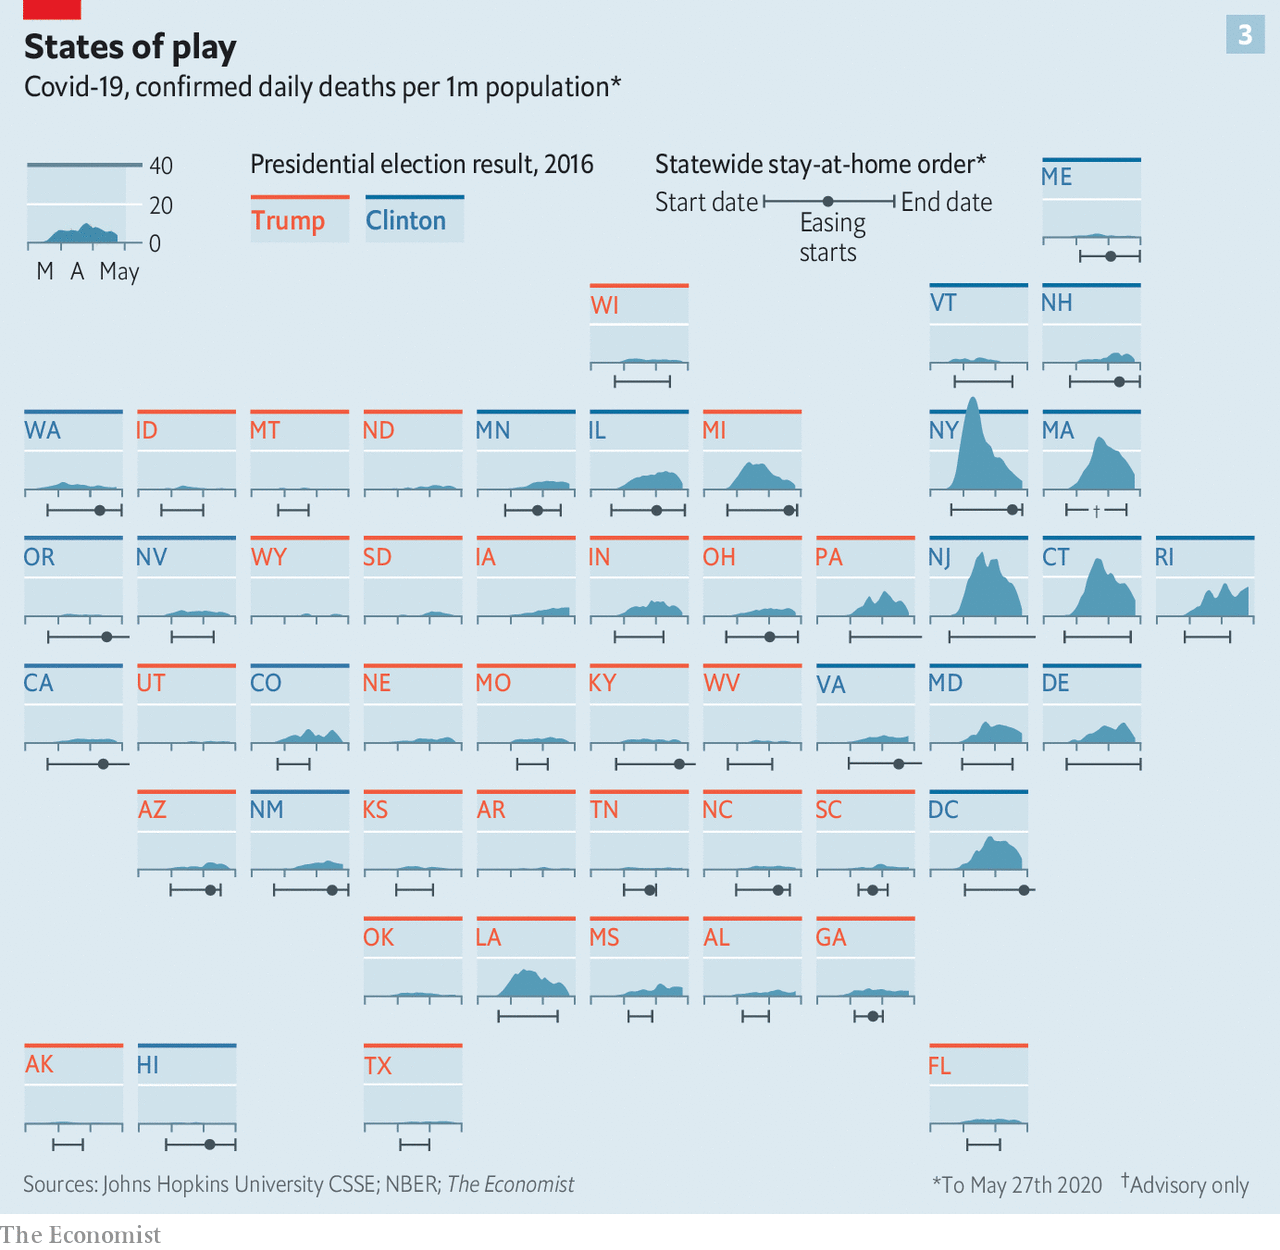
- html: "COVID-19 States Analysis" (the alt text)
B. Image with Absolute Path
Using absolute path - now works with /pm/ route directly:
This ensures the image works from any location in the system.
Direct Image URL Access (UPDATED):
- ✅ NOW WORKS: http://127.0.0.1:5001/pm/dataviz2/files/covid19-states-analysis.png
- ✅ Also works: http://127.0.0.1:5001/static/pm/dataviz2/files/covid19-states-analysis.png (if synced)
The /pm/ route now automatically serves images directly!
II. SVG Fragments (svg_)
SVG images are special - they're loaded inline allowing for CSS styling and JavaScript interaction.
A. SVG Example
When you use an SVG file:

The system creates:
- f_type: "svg_"
- data.src: Path to SVG
- data.content: The actual SVG markup loaded inline
B. Benefits of SVG Fragments
- CSS Styling: Can apply styles to SVG elements
- JavaScript Interaction: Can add event handlers
- Scalability: Perfect quality at any size
- Animation: Support for SMIL and CSS animations
III. HTML Fragments (html_)
HTML fragments allow embedding custom HTML content.
A. HTML Include via Image Syntax

Creates:
- f_type: "html_"
- data.src: Path to HTML file
- data.content: Rendered HTML content
B. Direct HTML in Code Blocks
Information
This is a custom HTML fragment.
IV. Blockquote Fragments (q_)
Blockquotes create visually distinct quoted content with special styling.
A. Simple Blockquote
Data visualization is a fundamental ingredient of data science as it "forces us to notice what we never expected to see" in a given dataset.
This creates:
- f_type: "q_"
- html: The blockquote content
- Beautiful gradient background with primary color border
B. Complex Blockquote with Formatting
Important Finding: The correlation between stay-at-home orders and COVID-19 death rates varies significantly by state.
V. Code Fragments (code_)
A. Python Code Block
import pandas as pd
import matplotlib.pyplot as plt

# Load COVID-19 data
df = pd.read_csv('covid19_states.csv')
df['deaths_per_million'] = df['deaths'] / df['population'] * 1_000_000

# Create visualization
plt.figure(figsize=(12, 8))
plt.bar(df['state'], df['deaths_per_million'])
plt.title('COVID-19 Deaths per Million by State')
plt.xticks(rotation=45)
plt.show()
B. JavaScript Code Block
// Interactive state selector
const states = document.querySelectorAll('.state-chart');
states.forEach(state => {
  state.addEventListener('click', (e) => {
    const stateCode = e.target.dataset.state;
    displayStateDetails(stateCode);
  });
});
VI. Executable Code Fragments (codex_)
Codex fragments support Python execution directly in the browser using Nagini/Pyodide.
A. Interactive Data Analysis
B. Interactive Bokeh Visualization
VII. Table Fragments (table_)
Tables are automatically detected and styled.
A. Data Table Example
| State | Deaths/Million | Lockdown Start | Political Lean |
|---|---|---|---|
| New York | 2,800 | March 22 | Clinton |
| Texas | 1,900 | April 2 | Trump |
| California | 1,600 | March 19 | Clinton |
| Florida | 2,100 | April 3 | Trump |
| Pennsylvania | 2,200 | April 1 | Trump |
B. Comparison Table
| Metric | Early Lockdown States | Late/No Lockdown States |
|---|---|---|
| Avg Deaths/Million | 1,850 | 2,450 |
| Peak Hospital Usage | 78% | 94% |
| Economic Impact | -8.2% GDP | -6.8% GDP |
| Recovery Time | 14 months | 11 months |
VIII. List Fragments (ul_, ol_)
A. Unordered List
Key findings from the COVID-19 state analysis:
- States with early lockdowns (before April 1) had 25% lower death rates
- Political affiliation showed correlation with lockdown timing
- Population density was a confounding factor not shown in the simple analysis
- Economic impacts varied more by state industry mix than lockdown duration
B. Ordered List (Analysis Steps)
- Data Collection: Gathered COVID-19 death data from Johns Hopkins CSSE
- Normalization: Converted to per-capita rates using 2020 census data
- Timeline Analysis: Mapped stay-at-home order dates for each state
- Correlation Study: Analyzed relationship between lockdown timing and outcomes
- Visualization: Created state-by-state comparison charts
IX. Interactive Radio Fragments (radio_)
A. Quiz Question
Which factor showed the strongest correlation with COVID-19 death rates?
X. Math Fragments (maths_)
Mathematical analysis of epidemic spread:
XI. Layout Control with Dividers (hr_)
Use dividers with special classes to control layout:
Column 1: State Data
The image shows COVID-19 death rates across all US states, color-coded by 2016 presidential election results.
Column 2: Key Insights
Blue states generally implemented lockdowns earlier, but outcomes varied significantly based on multiple factors including population density and healthcare infrastructure.
Early Response
States that locked down before April 1st
Delayed Response
States that locked down after April 1st
No Lockdown
States without statewide orders
Summary
This document demonstrates the rich variety of fragment types available in the PCA MathsPM system. Each fragment type serves a specific purpose:
- Visual fragments (
image_,svg_): Display static and interactive graphics - Code fragments (
code_,codex_): Show and execute code - Content fragments (
p_,q_,h1_-h4_): Structure textual content - Interactive fragments (
radio_,maths_): Create exercises and quizzes - Data fragments (
table_): Present structured information - Layout fragments (
hr_): Control visual arrangement
The COVID-19 state analysis image demonstrates how complex data visualizations can be embedded and referenced throughout educational content, providing visual context for data science concepts.