Organizational aspects, syllabus and evaluation criteria
A first example from Reuters
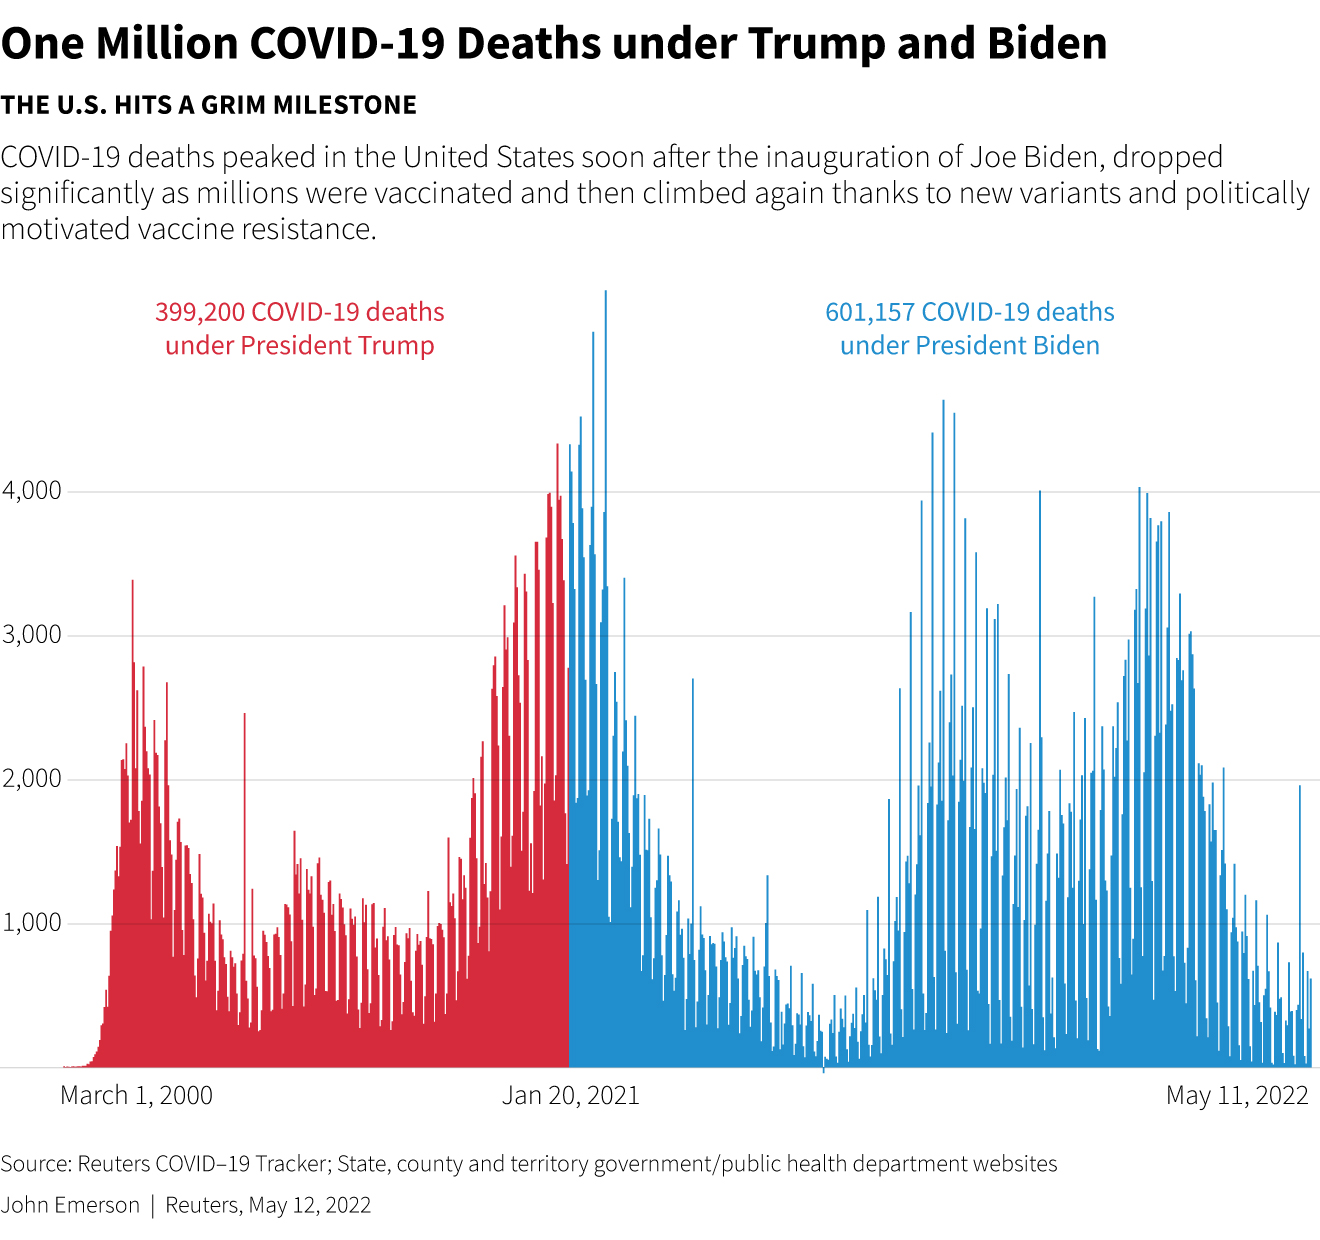
COVID-19 Mortality in the US
Can we make bold statements about the time-series of COVID-19 of numbers of deaths in the US ? Do we need more data ? The complete article from Reuters is available here. To better understand this chart and the conclusion we can draw, more details are provided here.
About this course
📝 Organizational details
- Teaching Language: English
- ECTS Credits: 1
- Duration:
- 15 hours lectures and tutorials (i.e. $3\times 5h= 15h$)
- 10 hours personal work
- Teaching material: See below
- "Slides"
- Exercises
✅ Prerequisites
- Basics on Python
- (secondary) Fundamental statistics and mathematics
- (secondary) Understanding of data structures (mostly
numpy.arrays,pandas.DataFrames)
Those two secondary aspects will be presented in the course, but not covered in depth.
🛠️ Technologies used in this course
Software: Python
Focus on the libraries:
- Matplotlib
- Bokeh
📊 Learning Outcomes
- Notions in graphic semiology to be able to choose the relevant vizualisation.
- Creation of interactive diagrams, cartographic or otherwise, to represent datasets, in Python.
🎯 Subjects Covered
Data visualization is a fundamental ingredient of data science as it “forces us to notice what we never expected to see” in a given dataset. Dataviz is also a tool for communication and, as such, is a visual language. All along the courses, we will focus on methods and strategies to represent datasets, using dynamic and interactive tools.
📝 Evaluation
The evaluation consists on a data vizualisation project. The students will have to build a web site based on Bokeh library. As this course doesn't include any web development concepts and tools, the student will have will have the right to use a Jupyter Notebook. Hence, bokeh interactivity will be avalaible