Practical work with bokeh server applications
Bokeh enables the implementation of interactive server applications that can be executed locally or deployed to a server.
Introduction to Bokeh server applications
What is a Bokeh server application?
Bokeh server application is a Python application that uses Bokeh to create interactive visualizations with real-time Python callbacks, data streaming, and server-side processing capabilities that are not available in static Jupyter notebooks.
Key advantages over notebook Bokeh
These server applications demonstrate features NOT available in static notebook output:
- Python Callbacks: Real-time Python function execution on user interactions
- Periodic Updates: Streaming and animated data with server-side timers
- Two-way Communication: Widgets that update plots and vice versa
- Shared State: Multiple plots sharing selections and data sources
- Dynamic Data: Add/remove/filter data on the fly with server processing
- Server-side Processing: Complex calculations in Python without JavaScript
Prerequisites
Make sure you have the libraries installed listed in : Installing Python, the clean way (in the last section: Installing the libraries for the course)
If you follow the above installation instructions, you should have the libraries installed in the virtual environment. Try not to forget to activate the virtual environment before running the applications.
Accessing the .py example files
- 01_simple_slider.py
- Download: Download link
- Download: Download link
- 03_real_time_streaming.py
- Download: Download link
- Download: Download link
- 05_linked_plots.py
- Download: Download link
- Download: Download link
- 06_interactive_presentation.py
- Download: Download link
- Download: Download link
- Image from FT used in the application 06
- Download: Download link
- Download: Download link
Running an application individually
Navigate to the folder containing the application file and execute the following command:
source env/bin/activate
bokeh serve 01_simple_slider.py
Be sure to have the image in the current directory when running :
bokeh serve 06_interactive_presentation.py
Then open your browser to: http://localhost:5006/01_simple_slider
Running multiple apps simultaneously
You can serve multiple apps at once:
bokeh serve 01_simple_slider.py 03_real_time_streaming.py 05_linked_plots.py 06_interactive_presentation.py
This will make all apps available at their respective URLs:
http://localhost:5006/01_simple_sliderhttp://localhost:5006/03_real_time_streaminghttp://localhost:5006/05_linked_plotshttp://localhost:5006/06_interactive_presentation
Run with custom options
To allow external connections:
bokeh serve --allow-websocket-origin="*" 01_simple_slider.py
To use a different port:
bokeh serve --port 5007 01_simple_slider.py
Server applications overview
01_simple_slider.py - Basic slider interaction
The simplest example of a Bokeh server application demonstrating real-time plot updates with a slider control.
Features:
- Single amplitude slider controlling a sine wave
- Real-time plot updates as slider moves
- Python callback function execution
- Console logging of value changes
Key concepts demonstrated:
- Creating interactive widgets (
Slider) - Attaching Python callbacks with
on_change - Updating plot data dynamically
- Document management with
curdoc()
# Key callback pattern
def update_amplitude(attr, old, new):
    y = amplitude_slider.value * np.sin(x)
    line.data_source.data = {"x": x, "y": y}

amplitude_slider.on_change("value", update_amplitude)
03_real_time_streaming.py - Live data streaming
Demonstrates real-time data streaming with start/stop controls and adjustable parameters.
Features:
- Start/stop streaming buttons
- Adjustable update rate (100-2000ms)
- Window size control for data points
- Real-time statistics display
- Datetime x-axis for time series
Key concepts demonstrated:
- Periodic callbacks with
add_periodic_callback - Managing streaming state
- Dynamic data windowing
- Real-time statistics calculation
- Button controls and state management
# Periodic callback pattern
callback_id = curdoc().add_periodic_callback(stream_data, 500)  # 500ms updates
This app is perfect for monitoring applications, IoT dashboards, or any scenario requiring live data visualization.
05_linked_plots.py - Linked selection across plots
Advanced example showing how selections can be synchronized across multiple plots using a shared data source.
Features:
- Four scatter plots with shared data source
- Box and lasso selection tools
- Selection linked across all plots
- Histogram of selected data updates dynamically
- Statistics table for selected points
- 500 data points with correlations
Key concepts demonstrated:
- Shared
ColumnDataSourceacross plots - Selection tools (
box_select,lasso_select) - Selection callbacks and indices
- Dynamic histogram generation
- HTML formatting in
Divwidgets
# Selection callback pattern
def update_histogram_and_stats(attr, old, new):
    selected = source.selected.indices
    if selected:
        selected_data = df.iloc[selected]
        # Update visualizations based on selection

source.selected.on_change("indices", update_histogram_and_stats)
This pattern is essential for building interactive data exploration tools where users need to investigate relationships between multiple variables.
06_interactive_presentation.py - Full presentation system 🆕
This application showcases how Bokeh can be used to create professional, interactive presentations that go far beyond static slides.
A complete presentation framework demonstrating the full power of Bokeh server applications.
Features:
- 7 interactive slides with different visualization types
- Navigation controls: Previous/Next/Home buttons
- Auto-play mode for hands-free presentation (5 seconds per slide)
- Progress bar and slide selector dropdown
- Multiple visualizations per slide:
- Welcome: Animated scatter plot with shuffle button
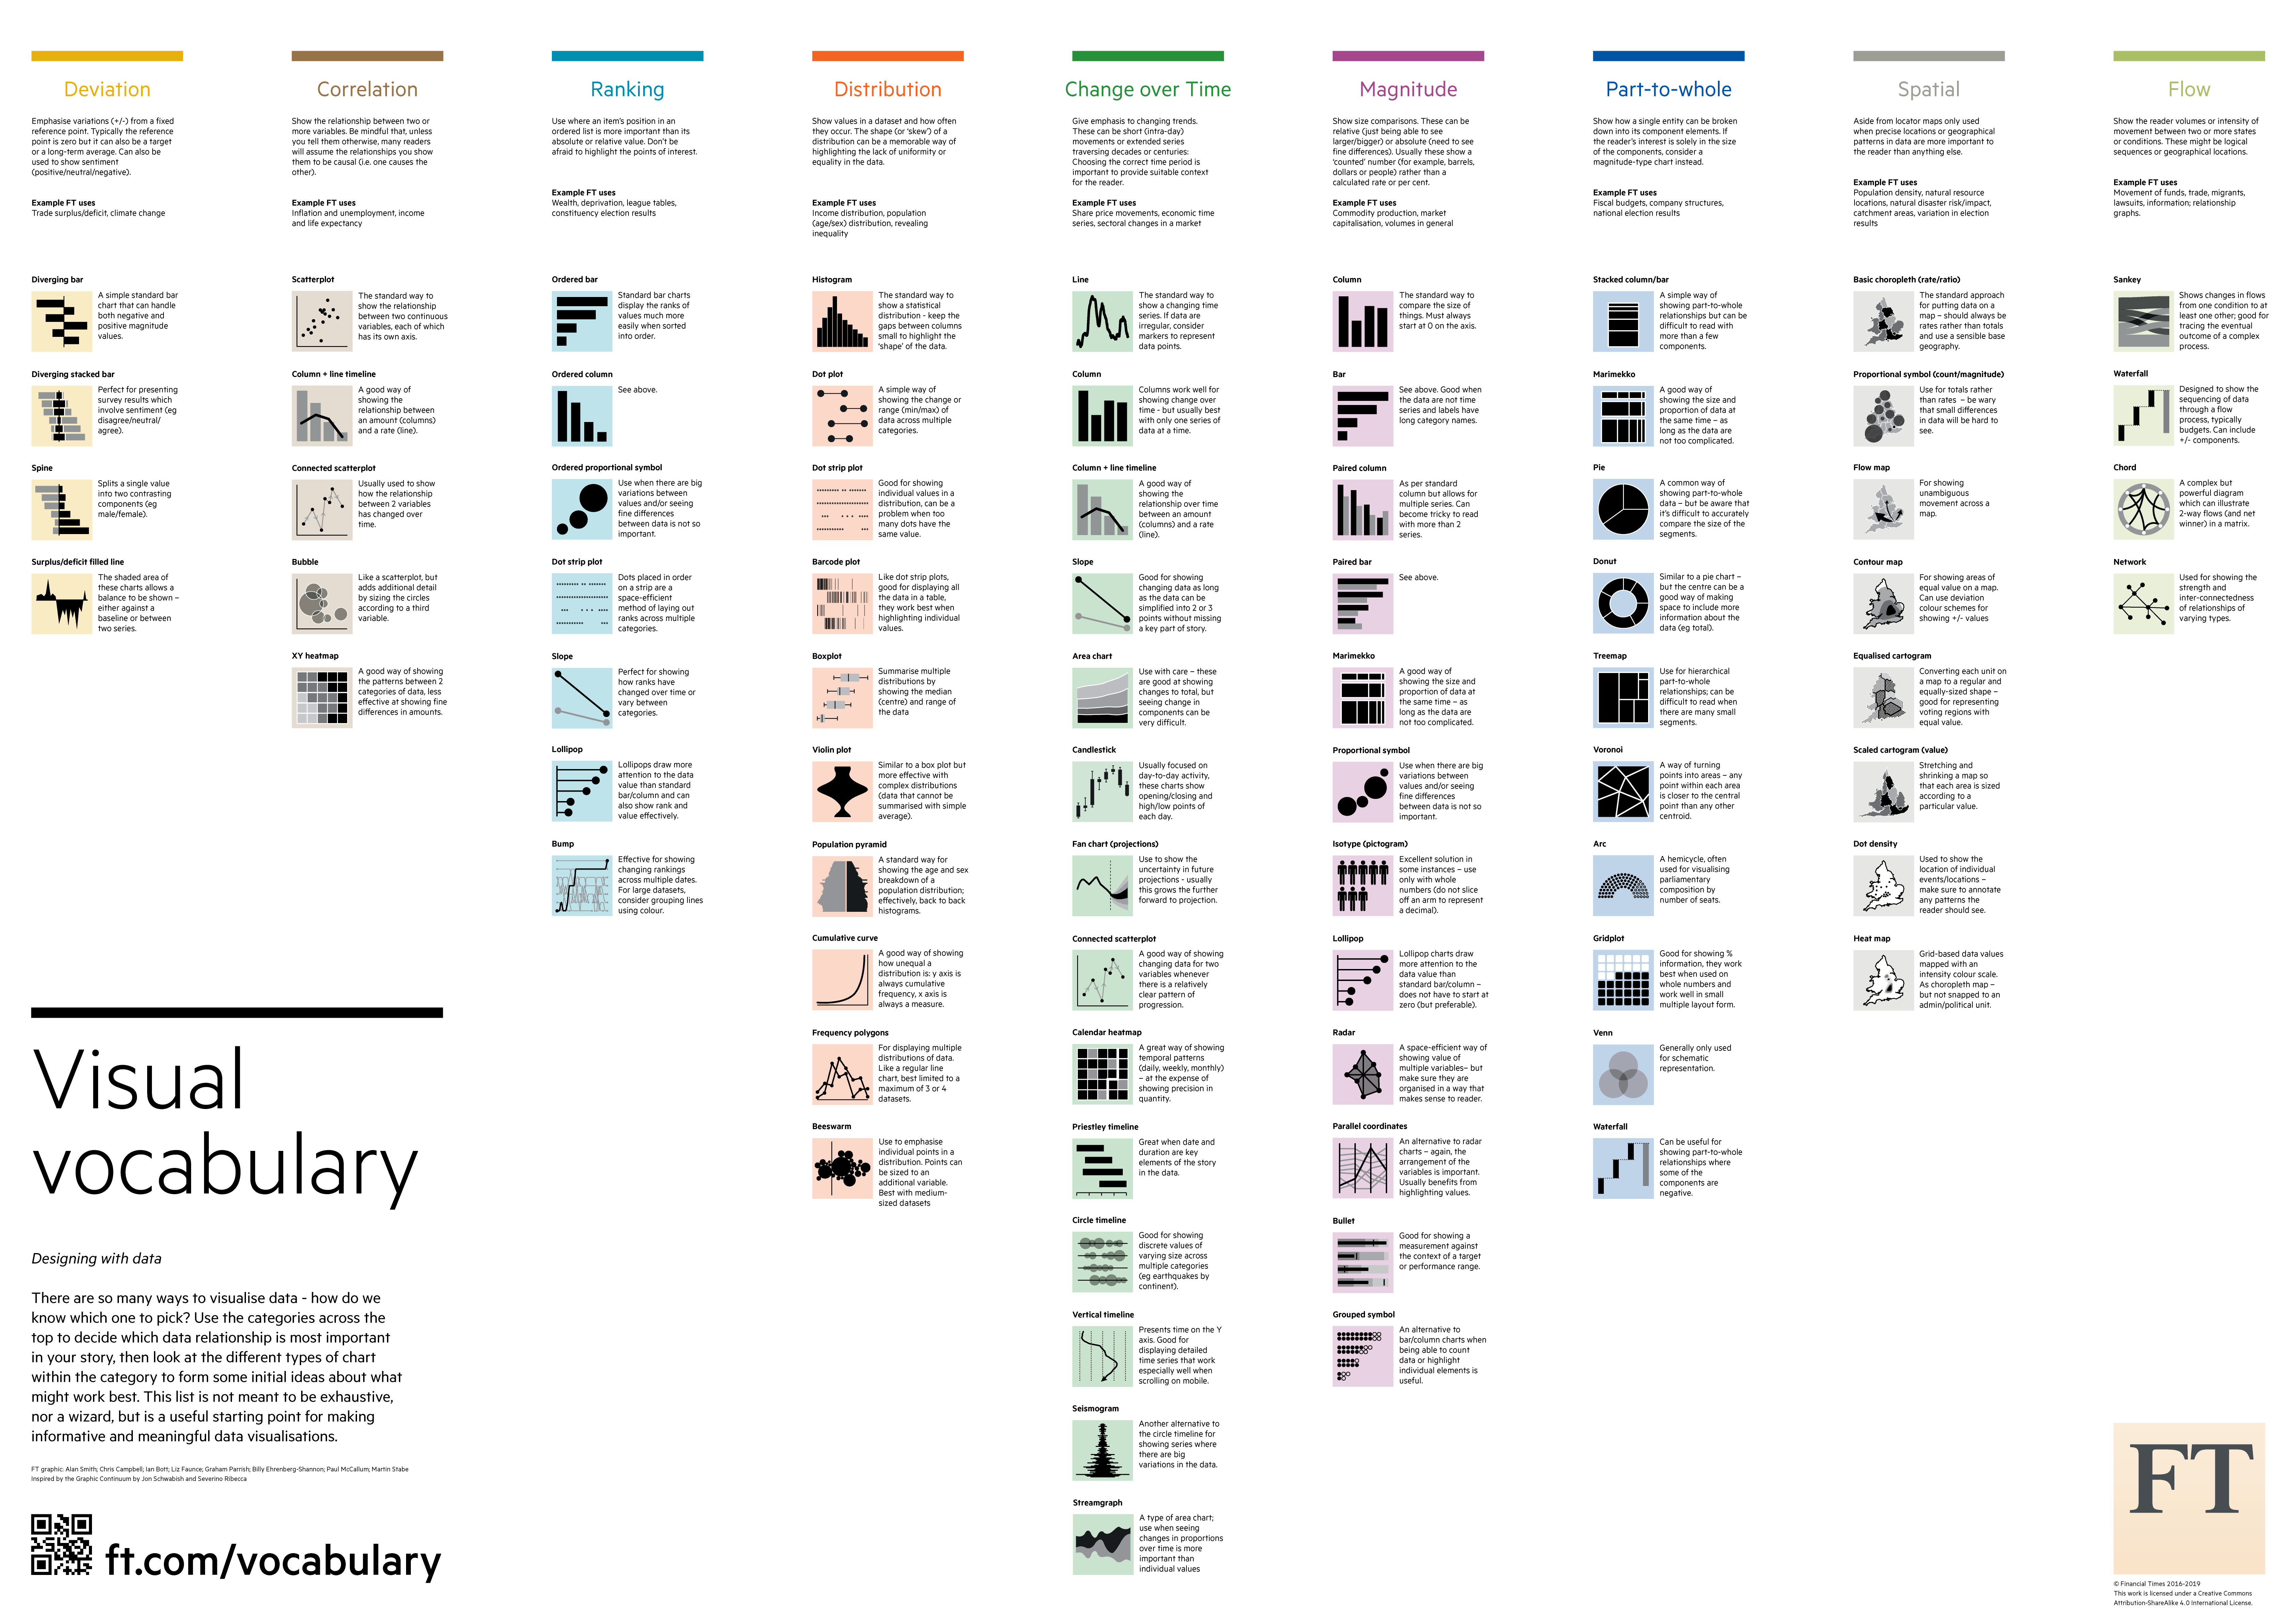
- Visual Vocabulary: Financial Times chart selection guide (embedded as base64 image)
- Data Overview: Dashboard with bar chart, line chart, and heatmap
- Interactive Explorer: Function plotter with multiple controls
- Time Series: Moving averages with hover tooltips
- Correlation Matrix: Interactive heatmap with color mapping
- Conclusions: Summary cards with key takeaways
Key concepts demonstrated:
- Complex application architecture with classes
- State management across slides
- Multiple plot types and layouts
- Advanced widgets and controls
- Auto-play with periodic callbacks
- Professional presentation formatting
# Class-based architecture
class InteractivePresentation:
    def __init__(self):
        self.current_slide = 0
        self.total_slides = 6
        self.create_slides()
        self.create_navigation()
Practical applications
When to use Bokeh server apps
Choose Bokeh server applications when you need:
- Real-time updates: Live data feeds, monitoring dashboards
- Complex interactions: Multi-step workflows, linked visualizations
- Server processing: Heavy computations that shouldn't run in the browser
- Stateful applications: User sessions, data persistence
- Production deployment: Web applications for multiple users
Common use cases
- Business Intelligence Dashboards: Real-time KPI monitoring
- Scientific Data Exploration: Interactive analysis tools
- Financial Trading: Live market data visualization
- IoT Monitoring: Sensor data streams
- Educational Tools: Interactive demonstrations
- Data Storytelling: Guided data narratives
Troubleshooting
Common issues and solutions
| Issue | Solution |
|---|---|
| Port already in use | Kill existing Bokeh server with Ctrl+C or use different port with --port |
| Module not found | Ensure all packages installed: pip install bokeh pandas numpy |
| No display in browser 1️⃣ | Check browser console for JavaScript errors |
| No display in browser 2️⃣ | Just be nice with yourself, don't try make it work in the browser, use the .py files instead |
| Slow updates | Adjust update rates in streaming apps, optimize data processing |
| Connection refused 1️⃣ | Check firewall settings, use --allow-websocket-origin for remote access |
| Connection refused 2️⃣ | You shouldn't have this issue if you use only local files (not HTTP requests) |
Exercises
Remember: These apps require an active Bokeh server connection. Closing the browser doesn't stop the server - use Ctrl+C in the terminal.
- Explore the source code: Each app is well-commented
- Modify existing apps: Change parameters, you can even add features
- Build your own: Start with simple examples and expand, in particular starting from
01_simple_slider.pyand05_linked_plots.pyand adapting them to your project
Adapting the 06_interactive_presentation.py application with your own data is a great way to practice and prepare for your final project: and it could actually be your final project.