Data Visualization: Course overview
Detailed plan and organization of the course
About this course
1️⃣ Session 1: Foundations & Graphic Semiology (3 hours)
Hour 1: Course Introduction & Visual Variables
- Course overview (i.e. the file you're currently reading)
- Graphic Semiology Fundamentals
Hour 2: Python: installation and philosophy
- [Recommended] Installing Python, the clean way
- The Zen of Python
Hours 3: Data types & first graphs
- Data Types Classification and introduction to
matplotlib - Data Visualization Project : Groups consitution and project data requirements
- Practical work with
matplotlib(1/2)
2️⃣ Session 2: Static data vizualisation panorama
Any issue related to the proper execution of code on your machine must be solved during this session. Feel free to ask for help.
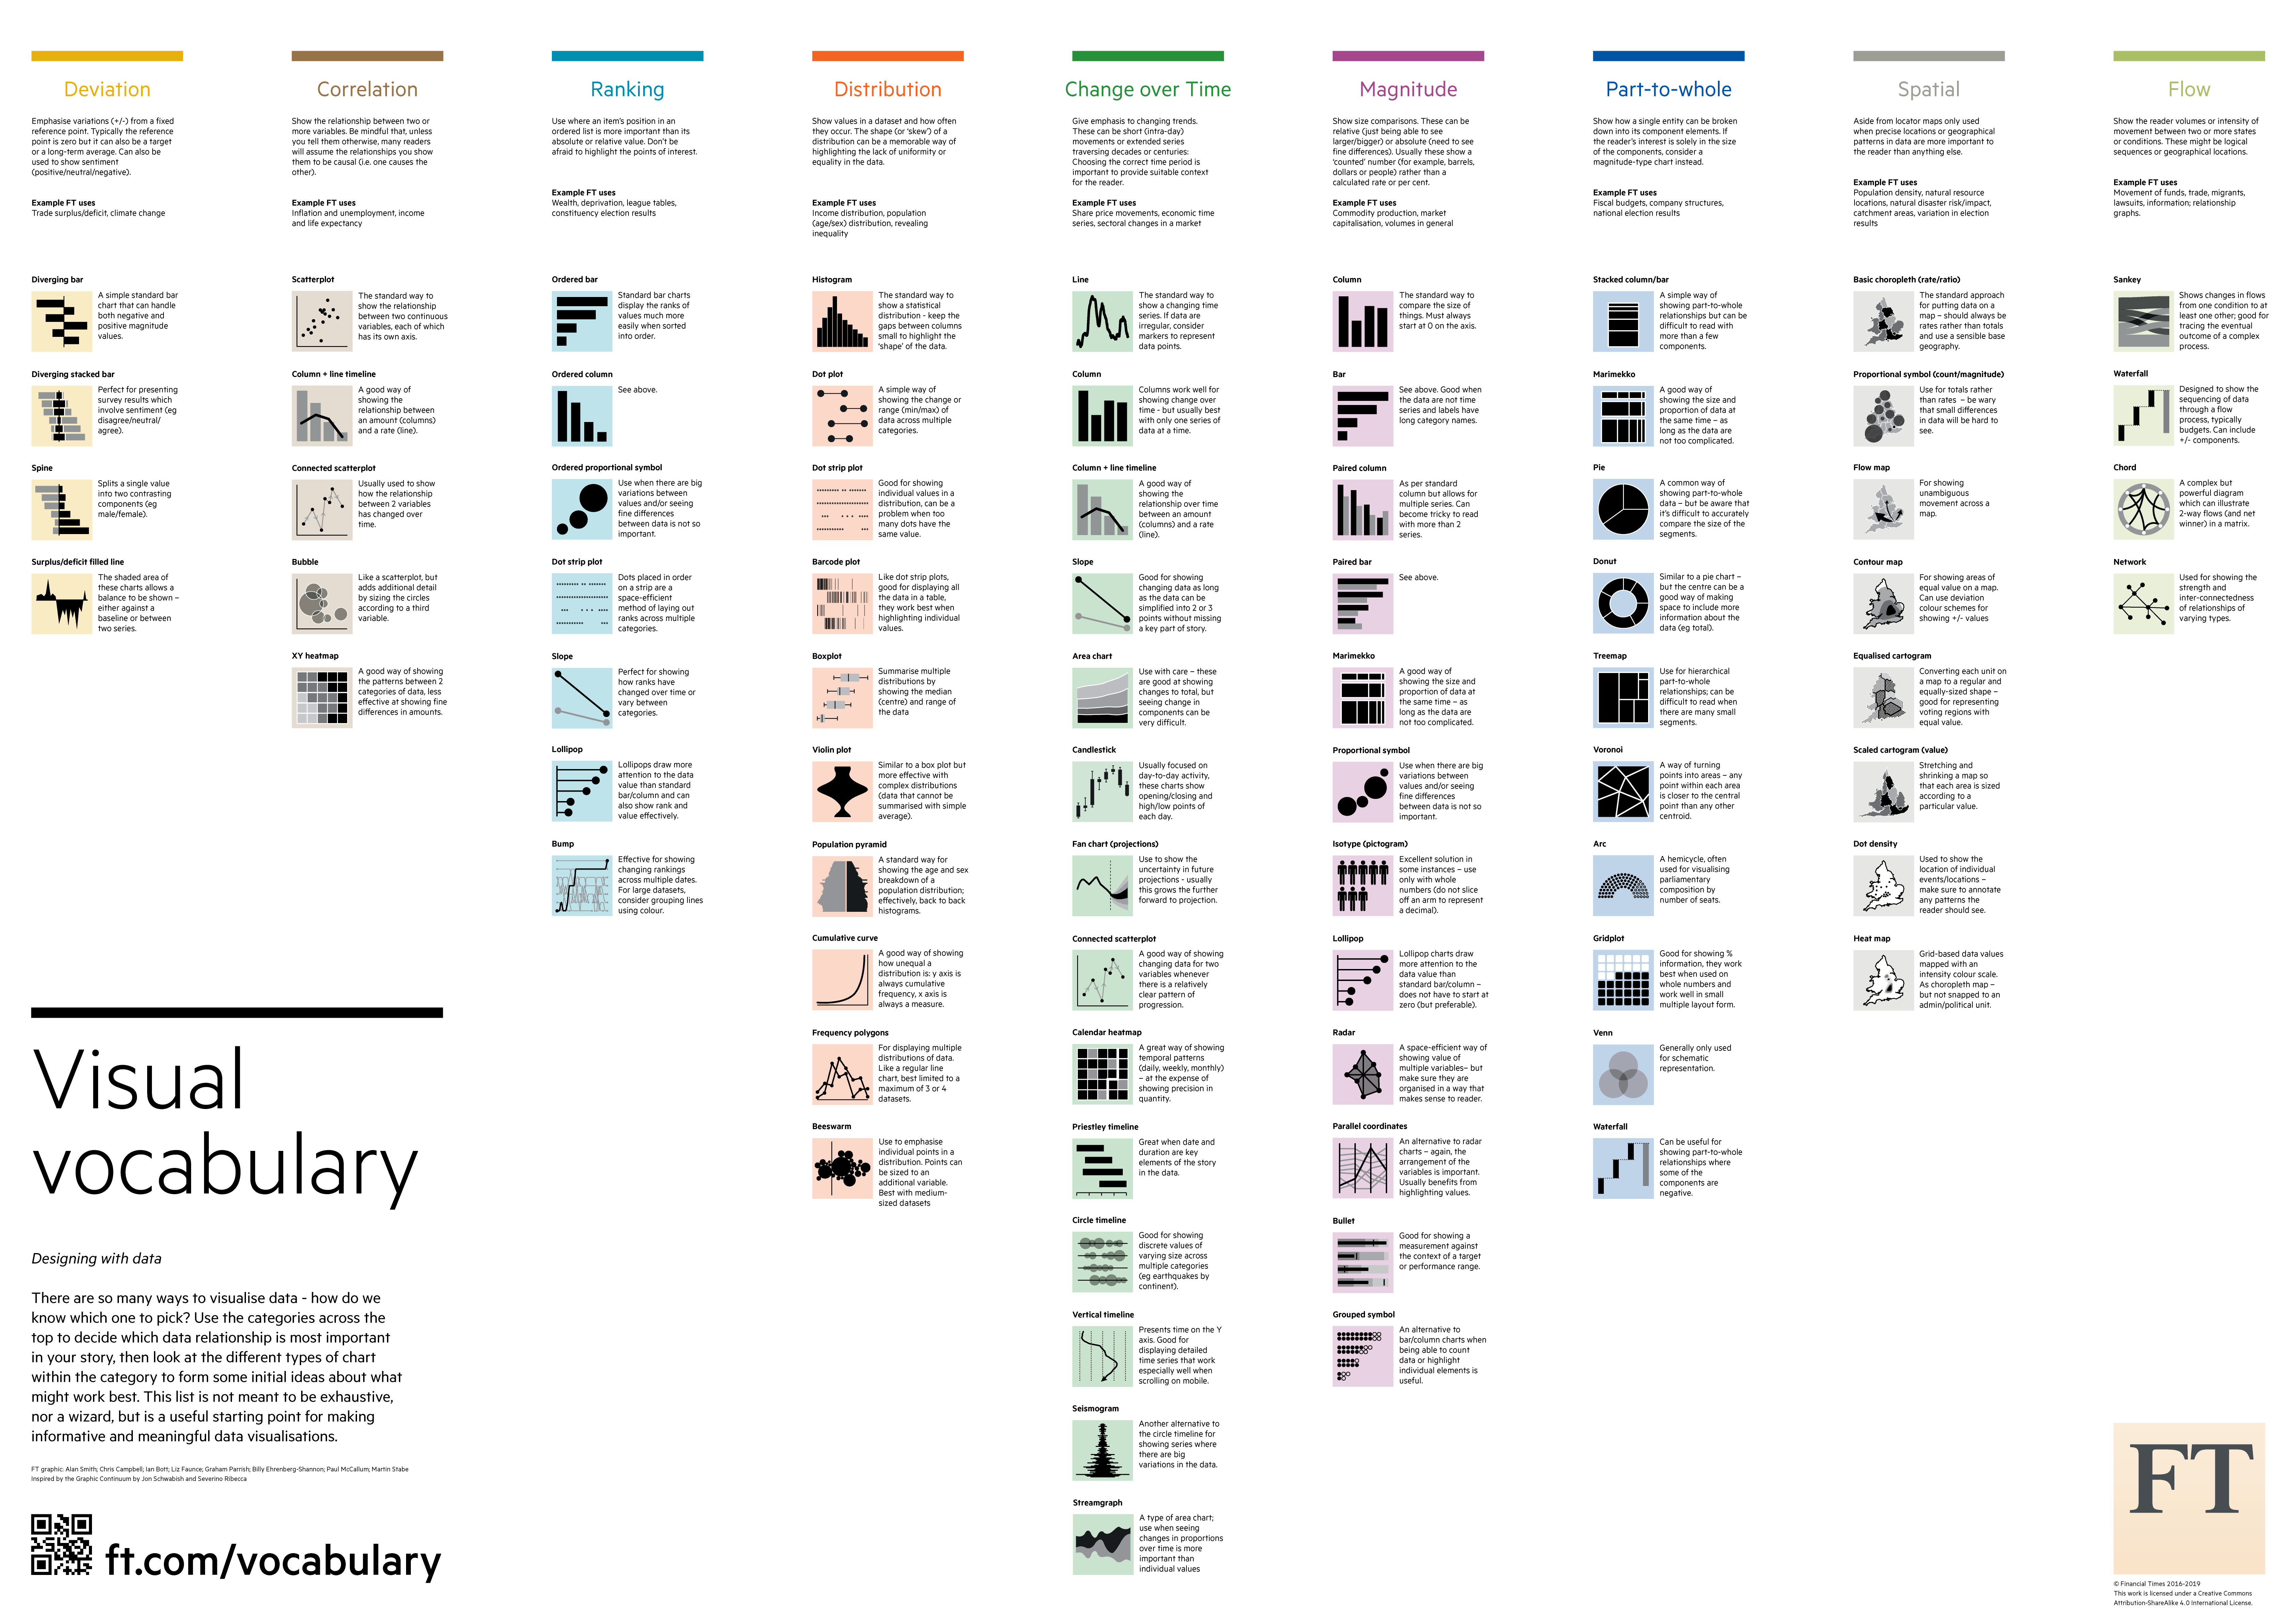
Hour 1 & 2: Static graphical representation panorama
Hours 3: Group work: project setup
- Data Visualization Project : Data selection & project planning
3️⃣ Session 3: Advanced data vizualisation
Each group must have selected a dataset and a project scope during hour 3.
It's good practice to think about the story you want to tell with your data. Combined with the characteristics of your data, this will help you to choose the relevant graph types.
Even though data modeling is not the scope of this course, prelaminary knowledge of the correlations and or causations and "forces at play" can help a lot to build story statistically defended.
Hour 1
- Practical work with
matplotlib(2/2) - Exercises 4 to 6
Hour 2
Hour 3
- Data Visualization Project : Story scripting & first graphs
- Data Visualization Project : Advanced visualizations (
bokeh)
4️⃣ Session 4: Practical Work
Hours 1 & 2
Hour 3
- Data Visualization Project : Advanced visualizations (
bokeh)
5️⃣ Session 5: Finale session & project presentations
Hour 1
Hour 2 & 3
- Data Visualization Project : final polish
- Data Visualization Project : presentation
Datasets
-
- Download: Download link
- Download: Download link
-
- Download: Download link
- Download: Download link
Corrections
- Practical work with
matplotlib(1/2)- Correction
- Download: Download link
- Practical work with
matplotlib(2/2) - Practical work with
bokehserver applications- 01_simple_slider.py
- Download: Download link
- 03_real_time_streaming.py
- Download: Download link
- 05_linked_plots.py
- Download: Download link
- 06_interactive_presentation.py
- 01_simple_slider.py
- Practical work: COVID 19 in the US
- Correction
- Download: Download link
- Practical work: COVID 19 in the US: cartographic representation
- Correction
- Download: Download link